Previous
¶ Insight Statement
¶ What it is
Insight Statements succinctly articulate the most valuable learnings or "aha" moments that emerge from your research.
¶ Why it is useful
An Insight Statement concisely summarises what you have learned and help you point the way forward. It helps narrow down some main insights you have discovered and is a basis for developing new ideas and solving the identified pain points.
¶ When to use
You can start creating Insight Statements after downloading all the findings and identifying key themes from your research, for instance, in Clustering.
¶ How is it done
- For this exercise, you will work with the clusters from the Clustering. For each of the clusters:
- Pick the top 3 - 5 post-its that best reflect the insight.
- Then, rephrase the cluster into a concise statement that expresses the critical insight from the cluster.
- Challenge the phrasing against the original cluster to ensure you got all the essential details.
- Following the creation of the Insights Statements:
- Reflect on the original Problem Statement.
- Discard any Insight Statements that do not relate.
¶ Do's & Don't
Do's
- All Insight Statements should be phrased human-centric, putting the interviewee at the centre.
- Keep the Insight Statement concise, ideally to one sentence that captures the true essence discovered.
- Use some real customer quotes to support your insight statements with some “real” evidence.
Don't
- Don’t jump to conclusions that stay at the level of data expressed and discovered in the research.
¶ Tools needed
- Whiteboard (virtual)
- Post-its from the Clustering exercise (virtual)
- Paper, pen (virtual)
¶ Example
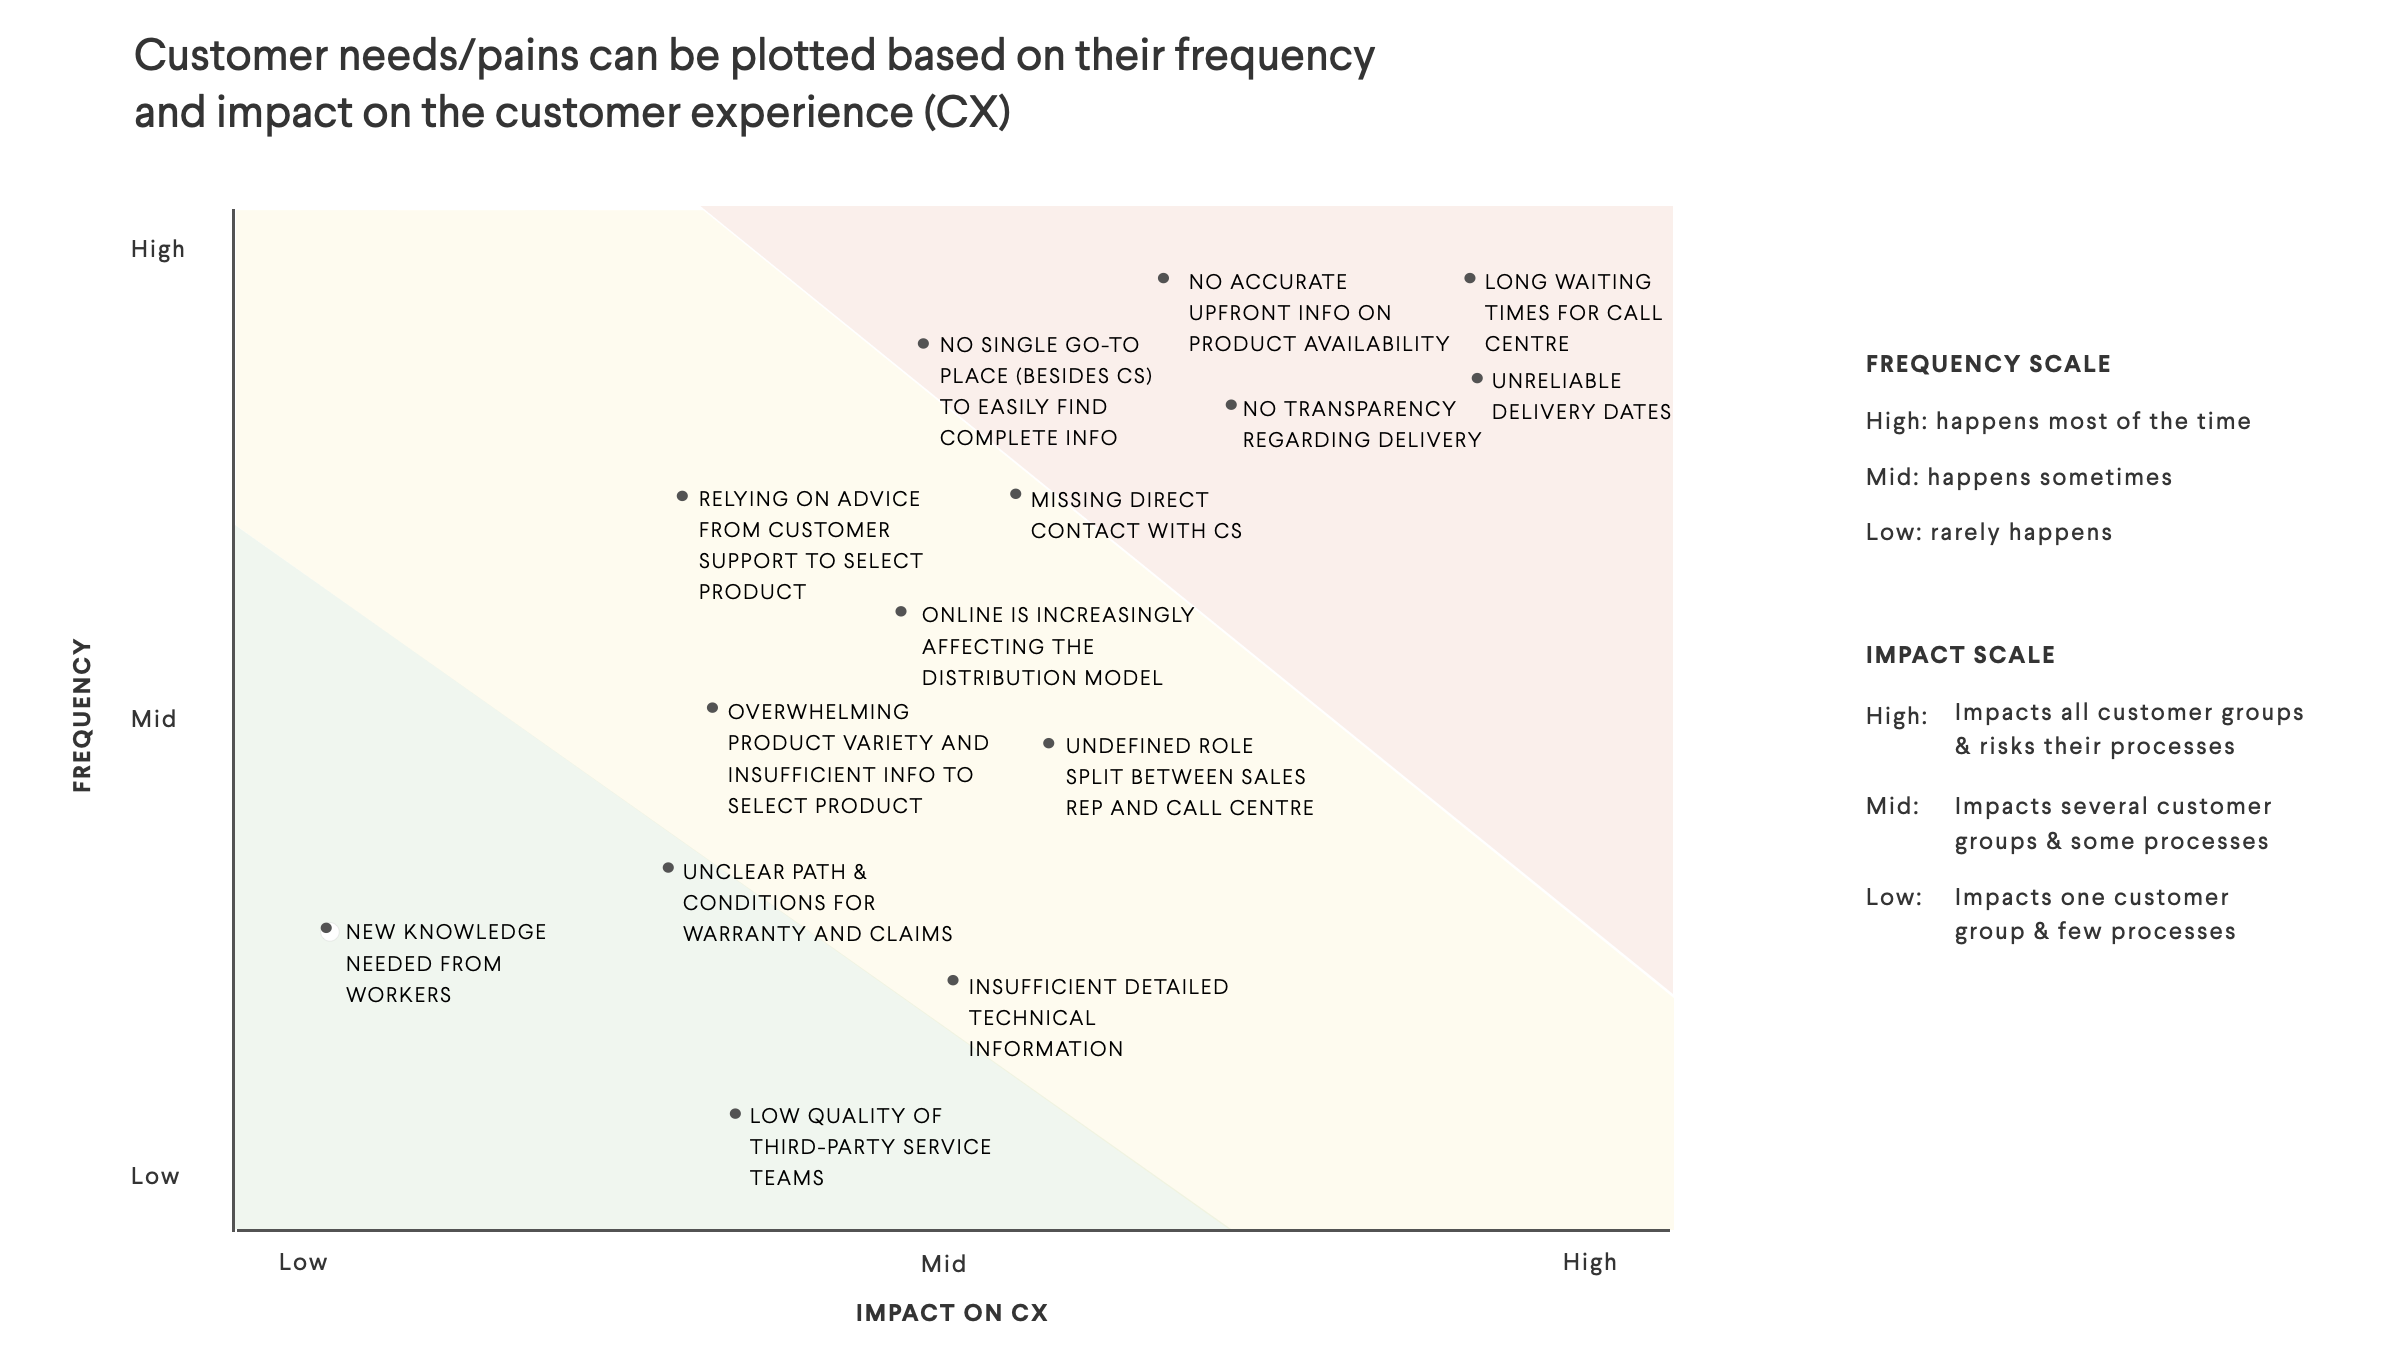
¶ Frequency-Impact-Matrix
¶ What it is
The Frequency-Impact-Matrix categorises Insight Statements or pain points, which you have found in your research, into four quadrants based on the impact on the customers’ experience and frequency of the event mentioned by the customers.
¶ Why it is useful
The Frequency-Impact-Matrix is one way to prioritise your research findings. It can help you set focus and decide where efforts should be allocated in the subsequent phases.
¶ When to use
This prioritisation technique can be used both in the Define phase to help you in the decision-making process and as part of an iterative process of Customer Testing and Prototyping to help you pivot a solution.
¶ How is it done
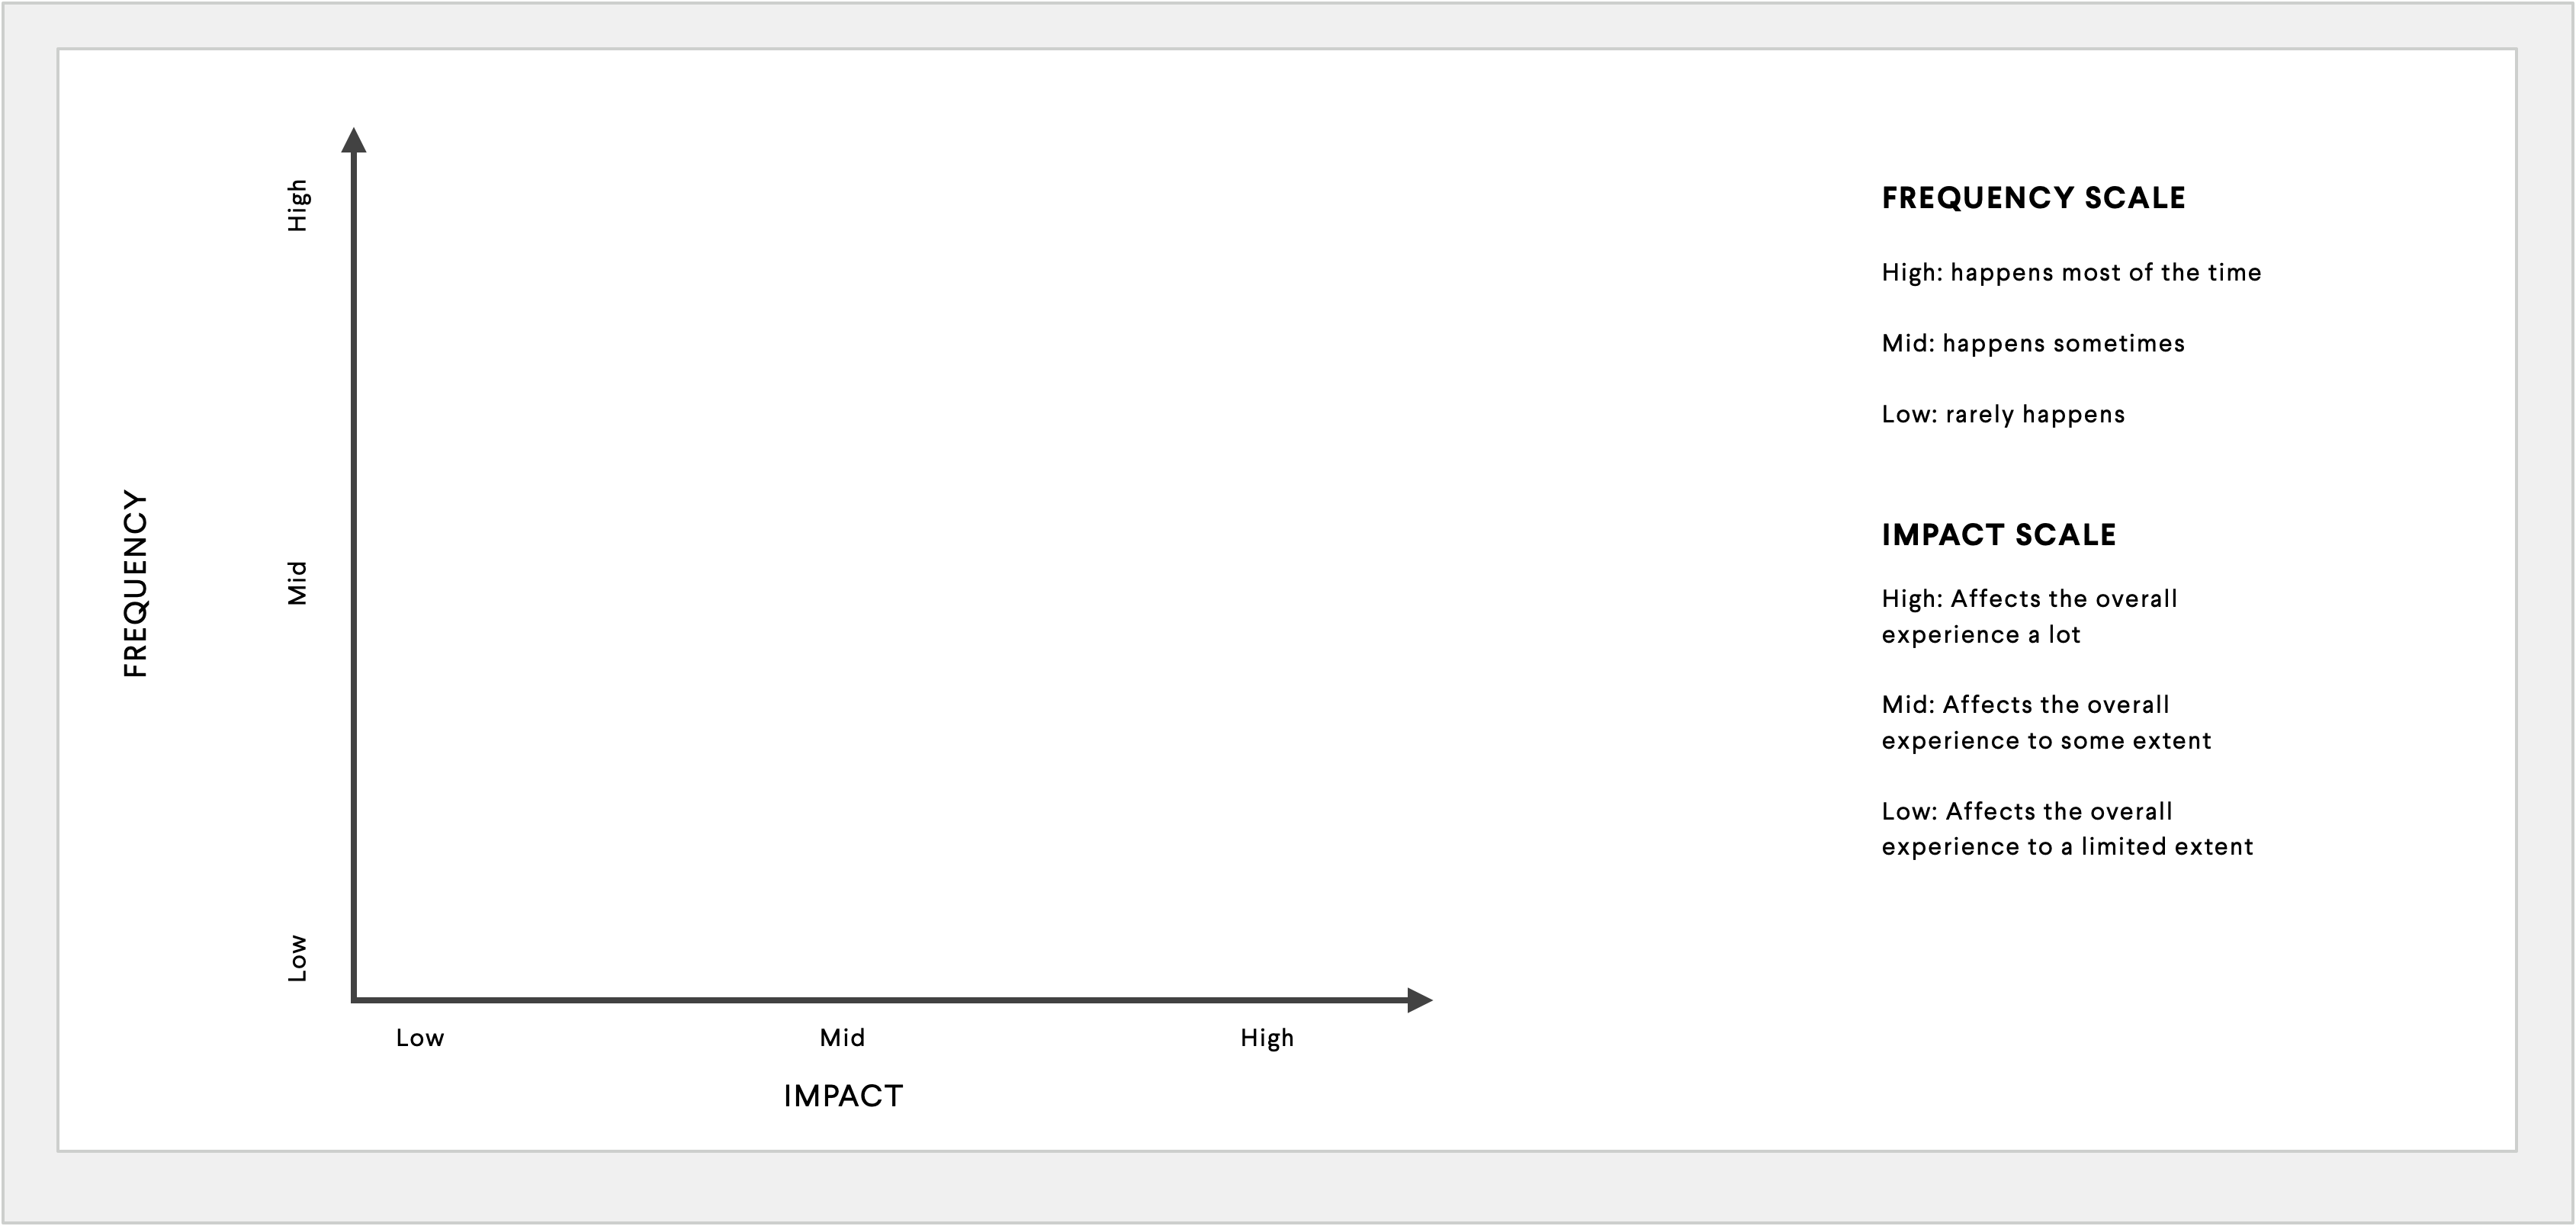
- On a whiteboard, draw a 2x2 matrix. The y-axis will denote “Low Impact” to “High Impact” on the spectrum, while the x-axis will denote “Low Frequency” to “High Frequency” on the spectrum.
- Review your Insight Statements or pain points. Find the approximate place for every Insight Statement or pain point in terms of the impact on the customer and the frequency of the event mentioned by the customers.
- How severe is the impact of the insight on the customer’s experience?
- How often did the customers talk about this experience?
- Name the four quadrants in the matrix. For example, the bottom left (4) will be “Nuisances,” the bottom right (3) will be “Irritants,” the top left (2) will be “Acute Problems,” and the top right (1) will be “Major Headaches.”
¶ Do's & Don't
Do's
- Be very discerning in your impact analysis, and consider various types of impact - including lost time, money, emotional impact, etc.
- Adjust along the way as needed if prior placement feels wrong based on further Insight Statements.
- Remember that this prioritisation matrix should help you focus on the most critical issues you are facing.
Don't
- Don’t try to solve everything in this matrix. This will explode the scope.
¶ Tools needed
- Whiteboard (virtual)
- Post-its with Insight Statements (virtual)
- Paper, pen (virtual)