Previous
¶ Survey
¶ What it is
A Survey is a predetermined set of questions sent out to research participants in a (typically virtual) document or form. Questions are standardised and often include Yes/ No or quantifiable questions.
¶ Why it is useful
By asking multiple people the same questions, you can generalise the insights collected and quickly gather information about your sample customer group, their opinions, and trends. In addition, surveys do not have to be executed in person and can be analysed using digital tools. Therefore, they help add some quantitative data to your insights without the significant time commitment.
¶ When to use it
Use surveys if you are seeking reliable, factual (as the customer said) data in a reasonably quick time and affordable budget. More so, use surveys when you draw relationships among questions, customer types, or categories and if you are seeking some quantitative data to have a statistical basis for inferences. On the other hand, do not use surveys if you desire a deeper understanding of a situation or future scenario.

¶ How is it done
- Select a customer group that you want to survey. Then, decide which areas you want to learn about. Your Survey questions should serve to understand the customers' background and answer your research questions.
-
Use the following types to formulate your questions:
- Categorial: Yes/No, Checkbox, Multiple choice questions, etc. (Example: Which tasks are part of your daily routine? - Spot checks/ Approval/ Client services)
- Filtering: Basis questions to filter the audience for follow-up questions. (Example: What do you like better? Office or on-site work?)
- Ranking: Participants rank a set of answer options based on criteria (Example: Rank these three attributes based on importance to you: Salary/ Work hours/ Cognitive challenge). You can also ask participants to rank a statement on a scale of 1-10 (Example: How likely are you to recommend this service?).
- Create your survey in a digital tool and send it via link or e-mail. Give respondents a few days to answer.
- Use analytical tools, e.g., tables, bar diagrams, or pie charts, to graphically understand and summarise the results.
¶ Do's & Don't
Do's
- Create one survey, but send it out separately to each customer group. Collecting results from each customer group separately allows you to generalise the findings per customer group and compare answers between groups.
- Use your Survey results to complement your other research findings. The collected data should be a quantitative addition to the insights from other research tools.
Don't
- Don’t overdraw conclusions from your survey; use it to support your other research findings. You can only precisely conclude what you have asked in your questions, but you cannot infer or interpret anything from the answers that are not explicitly stated.
- Don’t create a survey that would take longer than 10-15 minutes to complete. People’s attention spans are short, and they might give unthought answers.
¶ Tools needed
- Digital survey tools (e.g. Survey Monkey, Google Forms)
¶ GenAI Tool Use Case
¶ Enhance Survey Creation Process
Users can utilize the Qualtrics platform to efficiently design and deploy custom questionnaires by leveraging project templates, AI ExpertReview, and survey tools, thereby streamlining the process of questionnaire creation.
Key Steps Tutorial:
- Choosing the appropriate survey template
- Option 1: Select desired metrics, departments, use cases, and XM categories using the four filters on the left.
- Option 2: Enter keywords in the search box above the left filters to search for relevant survey templates.
- Use ExpertReview to optimise survey design
- Click “ExpertReview Score” or click “Tools” > “Review” > “Analyze Survey” to open the ExpertReview menu
- Click “View recommendations” to see the optimisation suggestions made by AI
- Issues are sorted by severity by default, or you can choose to filter by issue type
- Optimise mobile survey experience
- Open the question editing pane
- Enable the “Mobile friendly” option
Other Inspirational Tool:
¶ Efficient Analysis and Reporting of Survey Responses
Users can use Qualtrics to filter, clean, and statistically analyze their survey responses. They can rapidly view and interpret results, including visualizations in default reports, and design engaging reports to share key findings effectively.
Key Workflows:
- Clarify your research question: Begin by identifying a core variable and hypothesising about it.
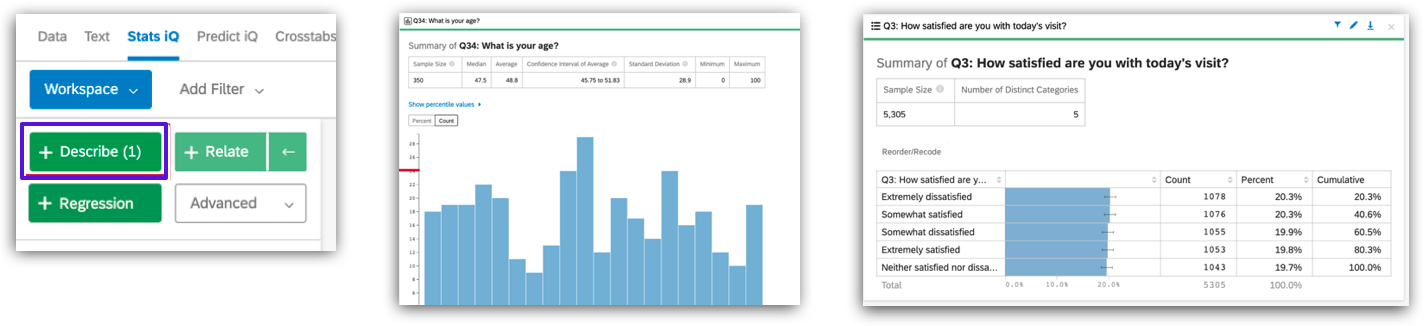
- Descriptive analysis: Before deep diving, initially use descriptive analysis tools to visualise and summarise the data.
- Go to the “Data & Analysis” tab > click “Stats iQ”
- Select one or multiple variables > click “Describe”
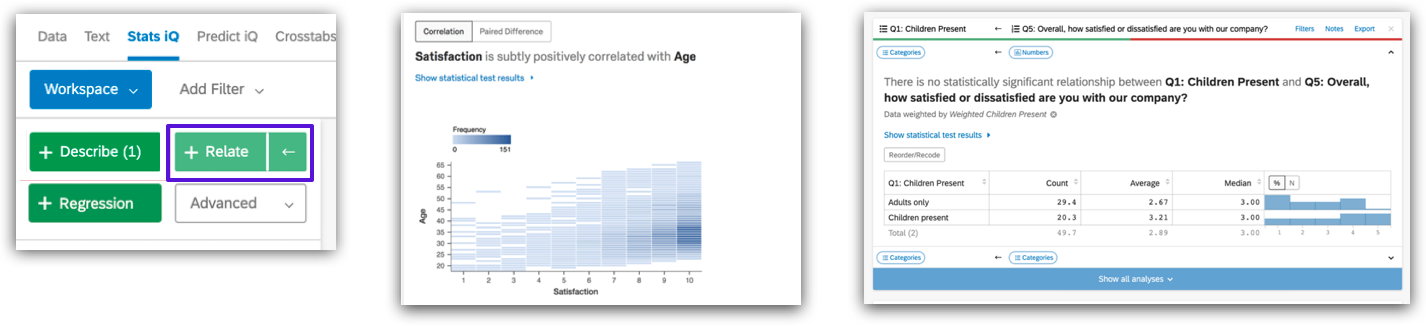
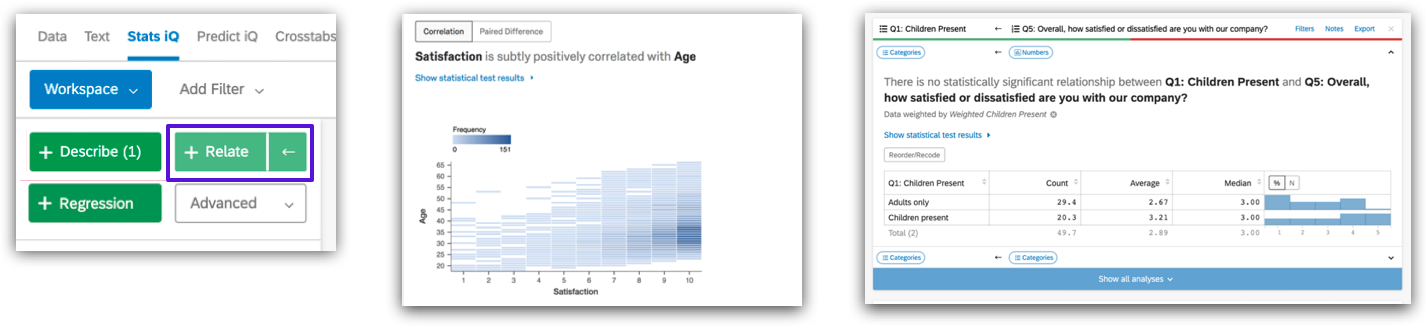
- Correlation analysis: Select variables for correlation analysis, Stats iQ will choose appropriate statistical methods for different data relationships and interpret the results in an easy-to-understand language, highlighting the most significant relationships.
- Select two or more variables (if more than two, the first selected one will be the key/output variable, and each non-key variable will be related to it) > click “Relate”
- Regression analysis: Regression shows how multiple input variables impact an output variable together. For example, if the input variables 'Price', 'Formulation and Ingredients' and 'Fragrance' are all related to the output variable 'Customer Satisfaction with Shampoo' and to each other, then you can use regression to find out which of the three is more important in generating 'Satisfaction'.
- Select two or more related variables > click “Regression”
- You can change the key variable by clicking the key icon next to any variable in the variable pane
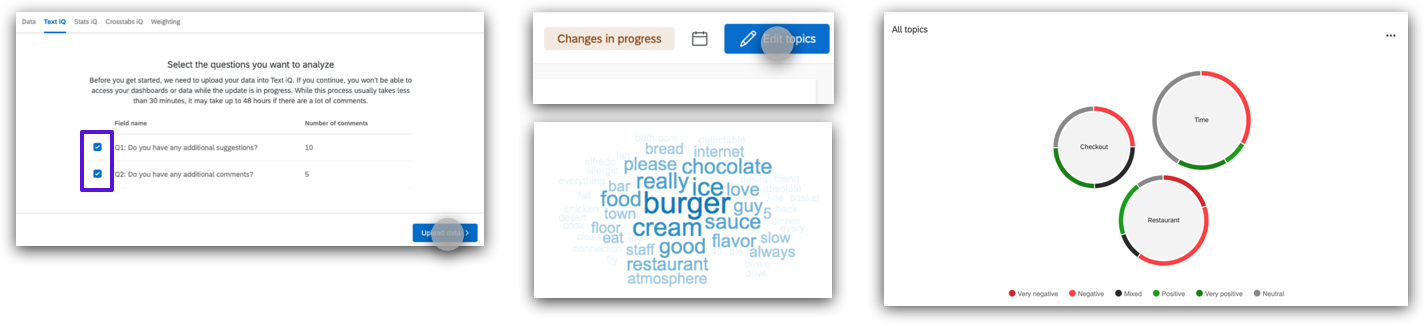
- Text analysis: Text iQ allows you to perform sentiment analysis, and report on your results with dynamic widgets.
- Go to the “Data & Analysis” tab > click “Text iQ”
- Click the checkboxes to select the open text fields you want to upload to Text iQ > click “Upload data”
- Click "Edit topics" to enter editing mode
- Now you can start adding/modifying topics and using widgets to visualise your text data’s meaning
- Results dashboards: Designed to give you a quick and simple visualization of your survey results.
- Advanced Reports: Created informative online reports with beautiful layouts and rich visualization.